Recursion Part 2: Speed
Continuing from last week’s article on recursion limits, today we’ll talk about recursion speed. Is there a penalty for making recursive calls? Does it increase as the recursion gets deeper and deeper? Read on to find out.
Converting a recursive algorithm to an iterative approach often speeds it up as function calls are quite slow in AS3. That’s not our concern today. Today we’ll look at making the same number of function calls iteratively as we would do recursively. For example, we’ll compare the speed of function F calling itself 100 times to the speed of calling function F 100 times from a loop in another function. Here’s a snippet from the performance test showing how these “loops” are accomplished:
// recursive "loop"
function recurseTo(to:int, cur:int): void
{
	if (cur < to)
	{
		recurseTo(to, cur+1);
	}
}
recurseTo(100);

// iterative loop
function foo(): void {}
for (var j:int = 0; j < 100; ++j)
{
	foo();
}
Each “loop” will result in 100 function calls.
The following test works like this:
- The recursion limits technique is used to find how many recursions deep
recurseTocan go. - The two “loops” from above are used with progressively more function calls.
- To avoid an
Errorbeing thrown, the test stops when the recursion limit is reached
Here is the performance test:
package
{
	import flash.display.*;
	import flash.events.*;
	import flash.utils.*;
	import flash.text.*;

	public class RecursionSpeed extends Sprite
	{
		private var __logger:TextField = new TextField();
		private function log(msg:*): void { __logger.appendText(msg + "\n"); }
		private function logResult(calls:int, iterative:int, recursive:int): void
		{
			log(padInt(calls, 5) + " | " + padInt(iterative, 9) + " | " + padInt(recursive, 9));
		}
		private function padInt(val:int, chars:int): String
		{
			var str:String = val.toString();
			for (var pad:int = chars - str.length; pad > 0; --pad)
			{
				str += " ";
			}
			return str;
		}

		private var __recurseLimit:int;
		private var __curCallCount:int;

		public function RecursionSpeed()
		{
			__logger.autoSize = TextFieldAutoSize.LEFT;
			__logger.defaultTextFormat = new TextFormat("_typewriter", 10);
			addChild(__logger);
			log("Calls | Iterative | Recursive");

			stage.frameRate = 1000;
			addEventListener(Event.ENTER_FRAME, testCallLimit);
		}

		private function testCallLimit(ev:Event): void
		{
			try
			{
				recurseTo(__curCallCount, 0);
				__curCallCount+=10;
			}
			catch(err:Error)
			{
				__recurseLimit = __curCallCount;
				__curCallCount = 0;

				removeEventListener(Event.ENTER_FRAME, testCallLimit);
				addEventListener(Event.ENTER_FRAME, testCallSpeed);
			}
		}

		private function testCallSpeed(ev:Event): void
		{
			const REPS:int = 1000;
			var i:int;
			var beforeTime:int;
			var afterTime:int;
			const curCallCount:int = __curCallCount;

			beforeTime = getTimer();
			for (i = 0; i < REPS; ++i)
			{
				recurseTo(curCallCount, 0);
			}
			afterTime = getTimer();
			var recursiveTime:int = afterTime - beforeTime;

			beforeTime = getTimer();
			for (i = 0; i < REPS; ++i)
			{
				for (var j:int = 0; j < curCallCount; ++j)
				{
					foo();
				}
			}
			afterTime = getTimer();
			logResult(curCallCount, (afterTime-beforeTime), recursiveTime);

			__curCallCount += 200;
			if (__curCallCount > __recurseLimit)
			{
				removeEventListener(Event.ENTER_FRAME, testCallSpeed);
				stage.frameRate = 12;
				log("Recursion limit: " + __recurseLimit);
			}
		}

		private function recurseTo(to:int, cur:int): void
		{
			if (cur < to)
			{
				recurseTo(to, cur+1);
			}
		}

		private function foo(): void {}
	}
}
With Flash Player 10.1.102.64 (release plugin, release build) on a 2.4 Ghz Intel Core i5 running Mac OS X 10.6, I get the following results:
| Calls | Iterative | Recursive |
|---|---|---|
| 0 | 0 | 0 |
| 200 | 2 | 3 |
| 400 | 3 | 6 |
| 600 | 3 | 5 |
| 800 | 4 | 7 |
| 1000 | 5 | 10 |
| 1200 | 6 | 13 |
| 1400 | 7 | 15 |
| 1600 | 8 | 16 |
| 1800 | 9 | 19 |
| 2000 | 10 | 21 |
| 2200 | 11 | 23 |
| 2400 | 12 | 25 |
| 2600 | 13 | 27 |
| 2800 | 14 | 30 |
| 3000 | 16 | 32 |
| 3200 | 17 | 35 |
| 3400 | 17 | 37 |
| 3600 | 18 | 39 |
| 3800 | 19 | 42 |
| 4000 | 21 | 44 |
| 4200 | 22 | 45 |
| 4400 | 23 | 49 |
| 4600 | 24 | 51 |
| 4800 | 25 | 53 |
| 5000 | 27 | 56 |
| 5200 | 27 | 59 |
| 5400 | 28 | 62 |
| 5600 | 28 | 65 |
| 5800 | 30 | 67 |
| 6000 | 31 | 70 |
It can be hard to tell the trend from such a wall of numbers, so here’s a chart showing performance as function calls increase:
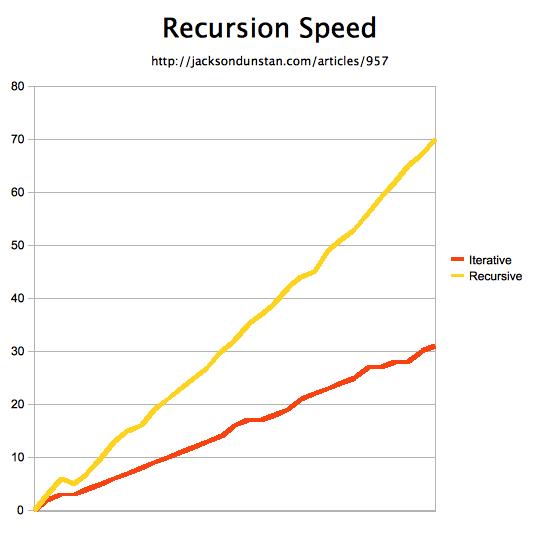
As you can see, the iterative approach beats the recursive approach even with small numbers of function calls. This shows recursion to be expensive not just because it involves a lot of function calls, but for some other reason as well. You would therefore be wise to avoid recursion in performance-critical areas even if your alternate approach involves just as many function calls. This is especially true for very deep recursion, as the CPU hit becomes quite great after just a thousand function calls or so, even with a function that’s empty except for the “loop” function call. On a lower-end machine or a mobile device, this could easily cause frame rate to drop.
#1 by skyboy on November 29th, 2010 ·
The reason for the increased amount of time is likely due to the used stack space, recursive functions don’t release any of that to be used again (depending on how Adobe does it, this could have its own performance hit to grow the space to the maximum), while the iterative approach is using then freeing a small amount of space. Running the recursive approach a second time might yeild different results, and if you add a simple variable increment to the other function it could also affect the speed of the test.
Another test you might add, is to test a recursive function that does as quickSort does – up two calls per recursion level, and a variant that uses an iterative approach for half, and a recursive function call for the other half, as with DenseMap’s current implementation.
#2 by jackson on November 29th, 2010 ·
If you comment out these lines:
And add after them this line:
The test will run over and over. I did this and the results seem to be the same each time, with minor variation of course.
That’s not to say that stack space usage isn’t the reason for the performance discrepancy; it very well may be. Any memory allocation related to the stack would seem to not be the case though.
As for adding the variable increment, I intentionally left
fooempty as the variable increment lies elsewhere: in theforloop that keeps callingfoo. The+1inrecurseTois the equivalent of this.#3 by skyboy on November 30th, 2010 ·
I just ran two different tests to compare an empty loop to a loop that increments a variable, for some base line results, and a test to compare calling an empty function to calling a function that increments a variable; I didn’t quite get the results I expected.
Release Mode, stand-alone release player v10.1 r102.
WinXP Home SP2, single-core 2.703 GHz, 2 GB RAM.
15% average idle CPU usage.
Test 1:
Results:
Test 2:
Results:
While 100 million calls is a bit of a stretch, the results are unexpected, and non-trivial; There could be an unexpected impact on the test.
I can’t come up with a decent explanation of
iii++being faster than{ }either.#4 by skyboy on November 30th, 2010 ·
I modified the first test slightly, and got some significantly different results. Apparently, something about empty loops makes flash freak out.
Substituting these loops in respective order:
Gave these results:
Where just a truly empty loop is never faster than the incrementing loop. I can’t think of how or why this would happen, four commands (pushnull, pop, pushundefined, pop) seem to give the player a chance to optimize the loop in some way. (void has zero effect, so I’m guessing the compiler just excludes it entirely)
#5 by jackson on November 30th, 2010 ·
Very interesting results. Here are the results I get on a 2.8 Ghz Intel Xeon W3530 (quad core), 6 GB RAM, Windows 7:
With Test 1, the result shows the tiny amount of extra work that the increment adds. With Test 2, the result shows both the tiny amount of extra work that the increment adds, but also the more significant amount of work required just to access the
iiifield of the class. Look just how much extra work that one little increment adds! (MXMLC 4.1 bytecode)function private::empty():void /* disp_id 0*/ { // local_count=1 max_scope=1 max_stack=1 code_len=3 0 getlocal0 1 pushscope 2 returnvoid } function private::increment():void /* disp_id 0*/ { // local_count=3 max_scope=1 max_stack=2 code_len=18 0 getlocal0 1 pushscope 2 getlocal0 3 dup 4 setlocal1 5 getproperty private::iii 7 increment_i 8 setlocal2 9 getlocal1 10 getlocal2 11 setproperty private::iii 13 kill 2 15 kill 1 17 returnvoid }So the results that I’m getting aren’t very surprising to me. Your results for Test 2 align with mine, but your results for Test 1 are quite strange. I put the tests as an ENTER_FRAME listener and consistently (hundreds of times) see very similar results with “empty” always faster than “non-empty” for both tests. Unfortunately, I don’t know why your results would be so different than mine.
#6 by skyboy on November 30th, 2010 ·
It may have something to do with the older hardware: 2.7 GHz Intel Celeron overclocked to 2.703 GHz (don’t ask me why, it came that way), roughly 8 years old, possibly older.
Some instruction set that’s missing, possibly.
And I must say, the compiler really manages to kill even the simplest of tasks. I wonder how much of a performance hit that is compared to:
Or even:
#7 by skyboy on November 30th, 2010 ·
Well, it does have an impact, but it’s very minor (latter version): from 2013ms to 1930ms.
Changing it to:
Gets
1646mswhile the un-modified empty function gets1672mswhich can be dropped to1596msby simply returning immediately instead of pushing a scope. I don’t even see a reason for pushing the scope at this point, any time you access a variable on the class the compiler drops in another getlocal0.Also, hand optimizing through a hex editor on an uncompressed SWF written with FileReference/save(loaderInfo.bytes)
#8 by skyboy on November 30th, 2010 ·
With the functions modified as they were at the end of my above comment, I get these results in the browser:
It’s surprising and disappointing that all of the versions of FP are so different, but this also gives good news: DenseMap / JSON are probably significantly faster in the browser than in the tests I’ve done in the stand alone player. It’s too bad adobe can’t duplicate the speed of the plug-in in the stand-alone player, though.
And that may even be different on your machine, which is irritating in its own right.
Sorry for posting multiple times in a row.
#9 by jackson on November 30th, 2010 ·
If you’re making good posts (and you are!), then don’t worry about it.
Cool to hear that the hand-tuning results in a speedup. Perhaps there are some places in DenseMap that could benefit from some of that…
#10 by skyboy on November 30th, 2010 ·
With the exception of simple operations (ie.
var T:int = (left + right) * 0.5 + 0.5;) all of it needs hand tuning, but this comes with a price: I don’t yet know the spec well enough to change the length of a function, so any where I can shorten it and optimize it will be padded at the end with nop (0x02), which will slow it down because the entire function is read, dead code and all, and if I can’t make it the same length or shorter, then I can’t do it at all.I’m rewriting the quickSort function from scratch in bytecode to see how much of a speed gain I can give it, currently it takes 8 ms to Array’s 5 ms. I had to scrap my optimizations for reducing function calls, because none of them worked correctly in a random sort. A quick test I did on a really inefficient section resulted in a stack underflow, so I’ll need to poke at that some more before I can test the full thing.
#11 by jackson on November 30th, 2010 ·
You might want to use Apparat‘s
__asmsupport. It makes writing assembly easy since you can simply have functions that consist only of a call to__asm.#12 by skyboy on November 30th, 2010 ·
I tried using apparat at one point, but looking over the tutorial for it and it’s documentation, I got confused and couldn’t figure out how to use it, and the installing another program just to use it helped to run me off for now. Writing it via a hex editor (with notepad as a middle-man) isn’t fun, but it’s easy to do, particularly if you lay it out like this:
After I finish DenseMap I’m going to start work on a byte-code compiler I was working on before I knew about apparat, but back-burnered because I didn’t know the spec well enough to write all of it at that point, that’ll be an Adobe AIR project, and I may extend it to use external files for highlighting and compiling languages to AS3 bytecode, possibly other kinds of bytecode as well; The latter making it much more powerful as an all-around tool than just a utility.
#13 by Rackdoll on November 30th, 2010 ·
very nice article.
Exactly what i was looking for… thnx :)
#14 by as3isolib on November 30th, 2010 ·
Have either you Jackson or Skyboy noticed the differences when having a multitude of OS operations running while testing?
During some of my performance testing I have noticed both on Windows 7 as well as OS X 10.6 that the player performance varies on the same test dependent on what operations are in the background. I first caught glimpse of this while trying to capture a screenshot using Jing of my SWF in action.
#15 by jackson on November 30th, 2010 ·
I’ve certainly noticed that it contributes not only to overall slowness during the tests but also to unpredictability in the results. Since my testing is empirical, it’s important to get consistent results. I therefore always test with all programs closed except a single browser with a single tab displaying just the SWF I’m testing. There’s still a little “wiggle” in the numbers, but this technique sure does reduce it to the point where there’s no longer any statistically-significant variance and I feel comfortable posting results and drawing conclusions from them. In short, if you want accurate results you should test in isolation to the best extent you can. At the very least you should close any other apps that use lots of CPU or memory, especially other apps or web pages that use Flash.
#16 by skyboy on November 30th, 2010 ·
The effect also extends to any application running, there’s a finite amount of computation power, and these tests drain as much of it as they can; I mentioned somewhere that the best way to run the tests is with flash running on its own dedicated CPU core (nothing but flash runs on that core), however, that would be difficult to achieve, and it would probably only make the wiggle around 1% instead of 10%, if it has any effect; I’m not convinced Flash takes a constant amount of time given constant CPU loads, and this may be a result of instruction caching for all applications running, even with multiple cores.
My testing environment, unlike Jackson’s, is closer to a worst-case real-world simulation: a browser with between 20 and 200 tabs open, FlashDevelop, notepad, MSN, a Flash-powered chat live chat, occasionally a youtube video, music player or idle game. But even without all that, my computer exhibits odd behavior during some tests, like the empty loop test I posted above.
#17 by skyboy on December 5th, 2010 ·
This bug (imo, it really is a bug.) also affects native functions: Array’s sort method takes a whopping _2 minutes_ to complete a numeric sort on 20,000,000 elements in the
(i * 9301 + 49297) % 233280;order. DenseMap takes 27 seconds with the plain AS3 function, and 25 seconds with the ByteCode optimizations. Switching to a heapsort (smoothsort, specifically) will reduce this significantly, as would making it fully iterative instead of branching into a recursion for half of the sort.However, at a more realistic 10,000 elements, Array’s sort beats DenseMap by 2ms for the ByteCode sort, and 5ms for the AS3 sort.
#18 by jackson on December 5th, 2010 ·
There’s definitely more to the native version than a simple call to
qsort. You might want to check out ArrayClass.cpp in the Tamarin source to see more completely what’s going on. I would say that a 20 million-element sort is pretty huge. Have you tried some in-between lengths to see the trend? Consider a simple graph like I made for this article.Can’t wait to see your heapsort… then I’m sure you’ll do an assembly version of that too. :)
#19 by skyboy on December 5th, 2010 ·
heapsort’ll be merged with quickSort for > 100-500 recursions/iterations after quickSort is made iterative. for small partitions (< 10-50) while quickSorting, insertion sort will be used to get further speed ups. Hopefully, I'll match or beat Array's sort at a smaller number of elements.
Also, when a large amount of NaNs are used (the check for them adds a couple ms at 10,000 elements, and doubles the time taken at 20,000,000) Array's sort croaks: 20,000,000 elements takes _twelve minutes_. Twelve. At 10,000 elements it can take up to 300ms, and as low as 15ms (DenseMap still taking only 10-11 ms). Adobe has a lot of rather large issues to deal with it seems.
I'll attempt to make a graph come Friday, and leave it running overnight instead of running a virus scan that day.
#20 by skyboy on December 11th, 2010 ·
I’ve made a couple graphs, but I only went as far as 100,000 elements incrementing at 1,000 elements per test: http://www.skyript.com/2010/12/more-densemap-stats.html
There are a few issues with Array’s sorting method, the least of which is not taking the full O(n^2) time on all null and NaN elements.
#21 by skyboy on December 7th, 2010 ·
Another interesting part of recursion: Does function depth change the amount of time it takes to execute the code contained in the function?
#22 by jackson on December 7th, 2010 ·
I sure hope not! Still, I’ll make a note for future testing. If I find out it does, you’d better believe there will be an article about it!