How Many Temp Allocators Are there?
Last time we saw that jobs apparently have their own Temp allocator. Still, it was unclear how many of these allocators there are. One per job job? One per thread? Just one? Today we’ll run an experiment to find the answer!
The goal today is to discover which fixed-size blocks of memory Temp allocations come from. To this end, we’ll write a simple test job that performs a single small allocation and stores the returned memory address in a NativeArray. Along with that memory address, we’ll also store the job’s thread index. We can tell Unity to set this by adding a specially-named field with an attribute to the job struct:
[NativeSetThreadIndex]
internal readonly int m_ThreadIndex;
We’ll then run 100,000 of these jobs to ensure that they run on every job thread and likely even over multiple frames. We’ll also perform an allocation outside of the job system and add that to the results with 0 for the thread index.
Once all the jobs are complete, we can print several reports based on the data we collected. The first report is a CSV table with two columns: thread index and allocation. It’ll be 100,002 rows long including rows for the header and the out-of-job allocation. Because print will truncate such a large amount of data, we’ll save it to file.
The second report is a list of all of the unique allocations per thread, including the out-of-job allocation. If jobs running on any particular thread had their allocations return the same memory address, these allocations will all be counted just one time.
The third and final report is a list of all the unique allocations regardless of the job thread they were from.
Here’s the full source code for the test and the reports:
using System.Collections.Generic;
using System.IO;
using System.Text;
using Unity.Burst;
using Unity.Collections;
using Unity.Collections.LowLevel.Unsafe;
using Unity.Jobs;
using UnityEngine;

struct Allocation
{
    public int ThreadIndex;
    public long Address;
}

[BurstCompile]
unsafe struct TestJob : IJob
{
    [NativeSetThreadIndex]
    internal readonly int m_ThreadIndex;

    [WriteOnly]
    public NativeArray<Allocation> Alloc;

    public void Execute()
    {
        AddAllocation(Alloc, m_ThreadIndex);
    }

    public static void AddAllocation(
        NativeArray<Allocation> alloc,
        int threadIndex)
    {
        alloc[0] = new Allocation
        {
            ThreadIndex = threadIndex,
            Address = (long)UnsafeUtility.Malloc(4, 4, Allocator.Temp)
        };
    }
}

class TestScript : MonoBehaviour
{
    private NativeArray<Allocation>[] allocations;
    private NativeArray<JobHandle> handles;
    private bool isDone;

    private void Start()
    {
        const int numJobs = 100000;

        // Allocate allocation arrays
        allocations = new NativeArray<Allocation>[numJobs+1];
        for (int i = 0; i < allocations.Length; ++i)
        {
            allocations[i] = new NativeArray<Allocation>(
                1,
                Allocator.Persistent);
        }

        // Start jobs
        handles = new NativeArray<JobHandle>(numJobs, Allocator.Persistent);
        for (int i = 0; i < numJobs; ++i)
        {
            handles[i] = new TestJob
            {
                Alloc = allocations[i]
            }.Schedule();
        }

        // Add out-of-job allocations
        TestJob.AddAllocation(
            allocations[allocations.Length - 1],
            0);
    }

    private void Update()
    {
        // Stop if the test is already done
        if (isDone)
        {
            return;
        }

        // Complete jobs that are done
        // If any aren't done, stop
        for (int i = 0; i < handles.Length; ++i)
        {
            if (handles[i].IsCompleted)
            {
                handles[i].Complete();
            }
            else
            {
                return;
            }
        }

        isDone = true;

        // Report all allocations
        StringBuilder report = new StringBuilder(allocations.Length * 50);
        report.Append("Thread Index,Addressn");
        for (int i = 0; i < allocations.Length; ++i)
        {
            report.Append(allocations[i][0].ThreadIndex);
            report.Append(',');
            report.Append(allocations[i][0].Address);
            report.Append('n');
        }
        string path = Path.Combine(Application.dataPath, "allocs.csv");
        File.WriteAllText(
            path,
            report.ToString());
        print("Printed report to " + path);


        // Report unique allocations by thread
        Dictionary<int, HashSet<long>> threadAddresses
            = new Dictionary<int, HashSet<long>>();
        for (int i = 0; i < allocations.Length; ++i)
        {
            Allocation alloc = allocations[i][0];
            HashSet<long> set;
            if (!threadAddresses.TryGetValue(alloc.ThreadIndex, out set))
            {
                set = new HashSet<long>();
                threadAddresses.Add(alloc.ThreadIndex, set);
            }
            set.Add(alloc.Address);
        }
        report.Clear();
        List<KeyValuePair<int, HashSet<long>>> sortedThreads
            = new List<KeyValuePair<int, HashSet<long>>>(threadAddresses);
        sortedThreads.Sort((a, b) => a.Key - b.Key);
        foreach (KeyValuePair<int, HashSet<long>> kvp in sortedThreads)
        {
            report.Append(kvp.Key);
            report.Append(',');
            List<long> addresses = new List<long>(kvp.Value);
            addresses.Sort((a, b) => Comparer<long>.Default.Compare(a, b));
            for (int i = 0; i < addresses.Count; ++i)
            {
                report.Append(addresses[i]);
                if (i < addresses.Count - 1)
                {
                    report.Append(',');
                }
            }
            report.Append('n');
        }
        print(report.ToString());

        // Report unique allocations overall
        HashSet<long> allAddresses = new HashSet<long>();
        for (int i = 0; i < allocations.Length; ++i)
        {
            Allocation alloc = allocations[i][0];
            allAddresses.Add(alloc.Address);
        }
        report.Clear();
        List<long> allAddressesList = new List<long>(allAddresses);
        allAddressesList.Sort((a, b) => Comparer<long>.Default.Compare(a, b));
        for (int i = 0; i < allAddressesList.Count; ++i)
        {
            long address = allAddressesList[i];
            report.Append(address);
            report.Append('n');
        }
        print(report.ToString());
    }

    private void OnDestroy()
    {
        for (int i = 0; i < allocations.Length; ++i)
        {
            allocations[i].Dispose();
        }
        for (int i = 0; i < handles.Length; ++i)
        {
            handles[i].Complete();
        }
        handles.Dispose();
    }
}
Let’s run this with Unity 2019.3.2f1 and graph it as a scatter plot.
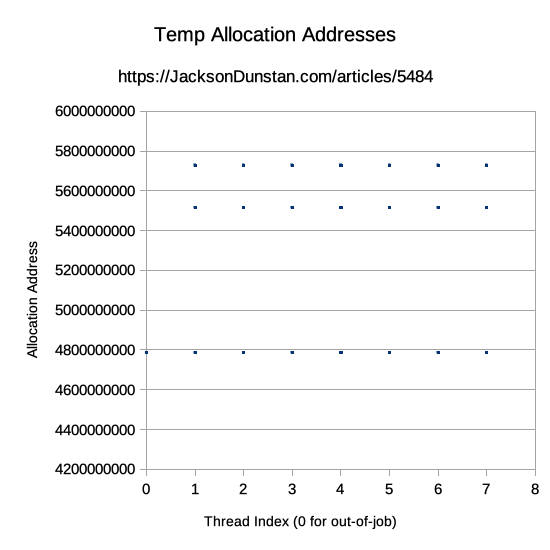
The scatter plot shows a very distinct grid-like pattern. There are allocations on job threads 1-7 in addition to 0 for the out-of-job allocation. That makes sense given that the test CPU is an Intel Core i7-6820HQ with 8 hardware threads.
We see one out-of-job allocation, which is all we did, but three allocations for each job thread. Given that we ran 100,000 jobs, a graph showing allocations at only 21 memory addresses is something to look into further. Here are just the first few rows of the full CSV file:
Thread Index,Address
6,5514925648
4,4785904864
6,5514925648
Already, we see that the same memory address is being allocated by multiple jobs on the same thread. This shows that the fixed-size block that backs the Temp allocator is being reused, at least on the same job thread.
Let’s go further and look at the next report which shows uniquely allocated memory address per thread. The first number is the thread index and the subsequent numbers are the memory addresses.
0,5727774816
1,4785480512,4785572336,4785803200,4785820144,4785887920,4785904864,5514925648,5727774816
2,4785480512,4785572336,4785803200,4785820144,4785887920,4785904864,5514925648,5727774816
3,4785480512,4785572336,4785803200,4785820144,4785887920,4785904864,5514925648,5727774816
4,4785480512,4785572336,4785803200,4785820144,4785887920,4785904864,5514925648,5727774816
5,4785480512,4785572336,4785803200,4785820144,4785887920,4785904864,5514925648,5727774816
6,4785480512,4785572336,4785803200,4785820144,4785887920,4785904864,5514925648,5727774816
7,4785480512,4785572336,4785803200,4785820144,4785887920,4785904864,5514925648,5727774816
Here we see again the one out-of-job allocation and 8 allocations on the job threads. That’s another curious result. Looking at the addresses, we see that they’re all the same! We even see the out-of-job allocated address being allocated by all of the job threads.
This is quite a find! It means that not only is the fixed-size blocks that back the Temp allocator being shared among jobs on the same thread, but it’s also shared between jobs on multiple job threads and even out-of-job allocations. There isn’t simply one fixed-size block per thread but rather each thread has access to all of the fixed-size blocks.
Now let’s look at the final report: unique allocations across all threads.
4785480512
4785572336
4785803200
4785820144
4785887920
4785904864
5514925648
5727774816
This short list neatly cuts down the duplicates in the last report to reveal that there are just 8 fixed-size blocks. Having run the test many times, the results are always consistent. The number of Temp allocators’ fixed-size blocks exactly matches the number of hardware threads on the CPU.